Documentation is currently for moon v2 and latest proto. Documentation for moon v1 has been frozen and can be found here.
Task profiling
Troubleshooting slow or unperformant tasks? Profile and diagnose them with ease!
Profiling is only supported by node based tasks, and is not supported by tasks that are created
through package.json inference, or for packages that ship non-JavaScript code (like Rust or Go).
CPU snapshots
CPU profiling helps you get a better understanding of which parts of your code require the most CPU time, and how your code is executed and optimized by Node.js. The profiler will measure code execution and activities performed by the engine itself, such as compilation, calls of system libraries, optimization, and garbage collection.
Record a profile
To record a CPU profile, pass --profile cpu to the moon run command. When
successful, the profile will be written to
.moon/cache/states/<project>/<task>/snapshot.cpuprofile.
$ moon run --profile cpu app:lint
Analyze in Chrome
CPU profiles can be reviewed and analyzed with Chrome developer tools using the following steps.
- Open Chrome and navigate to
chrome://inspect. - Under "Devices", navigate to "Open dedicated DevTools for Node".
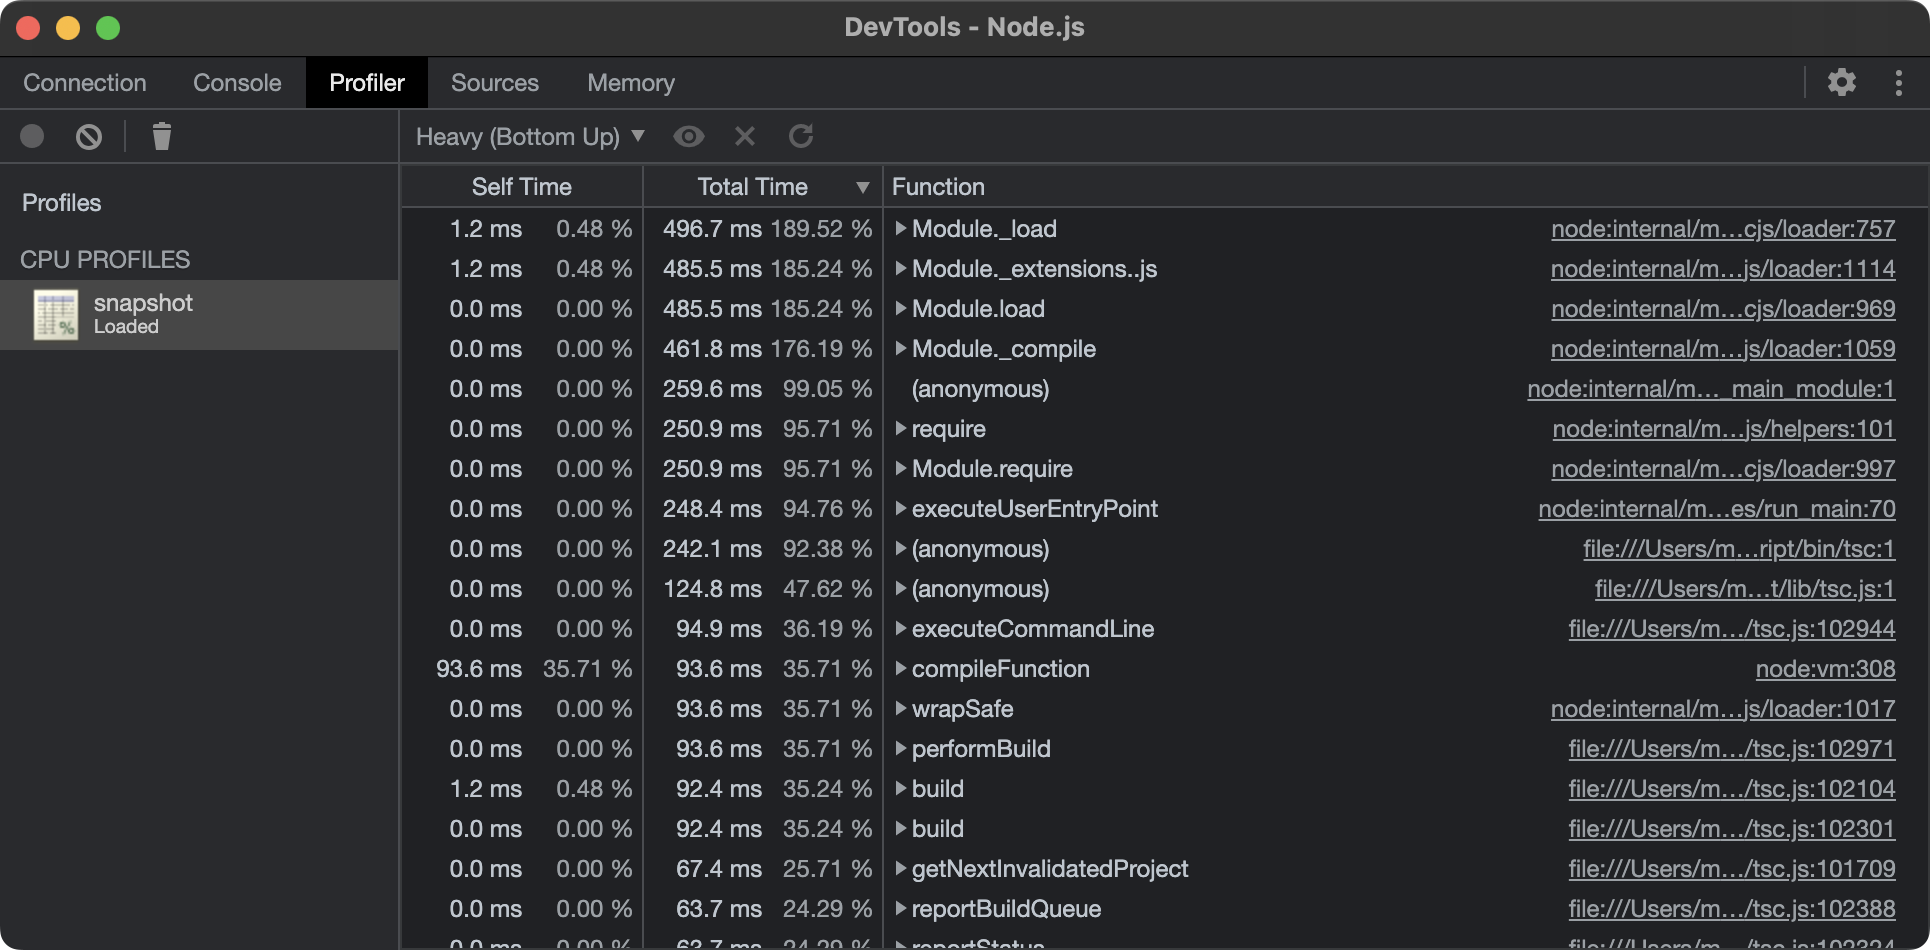
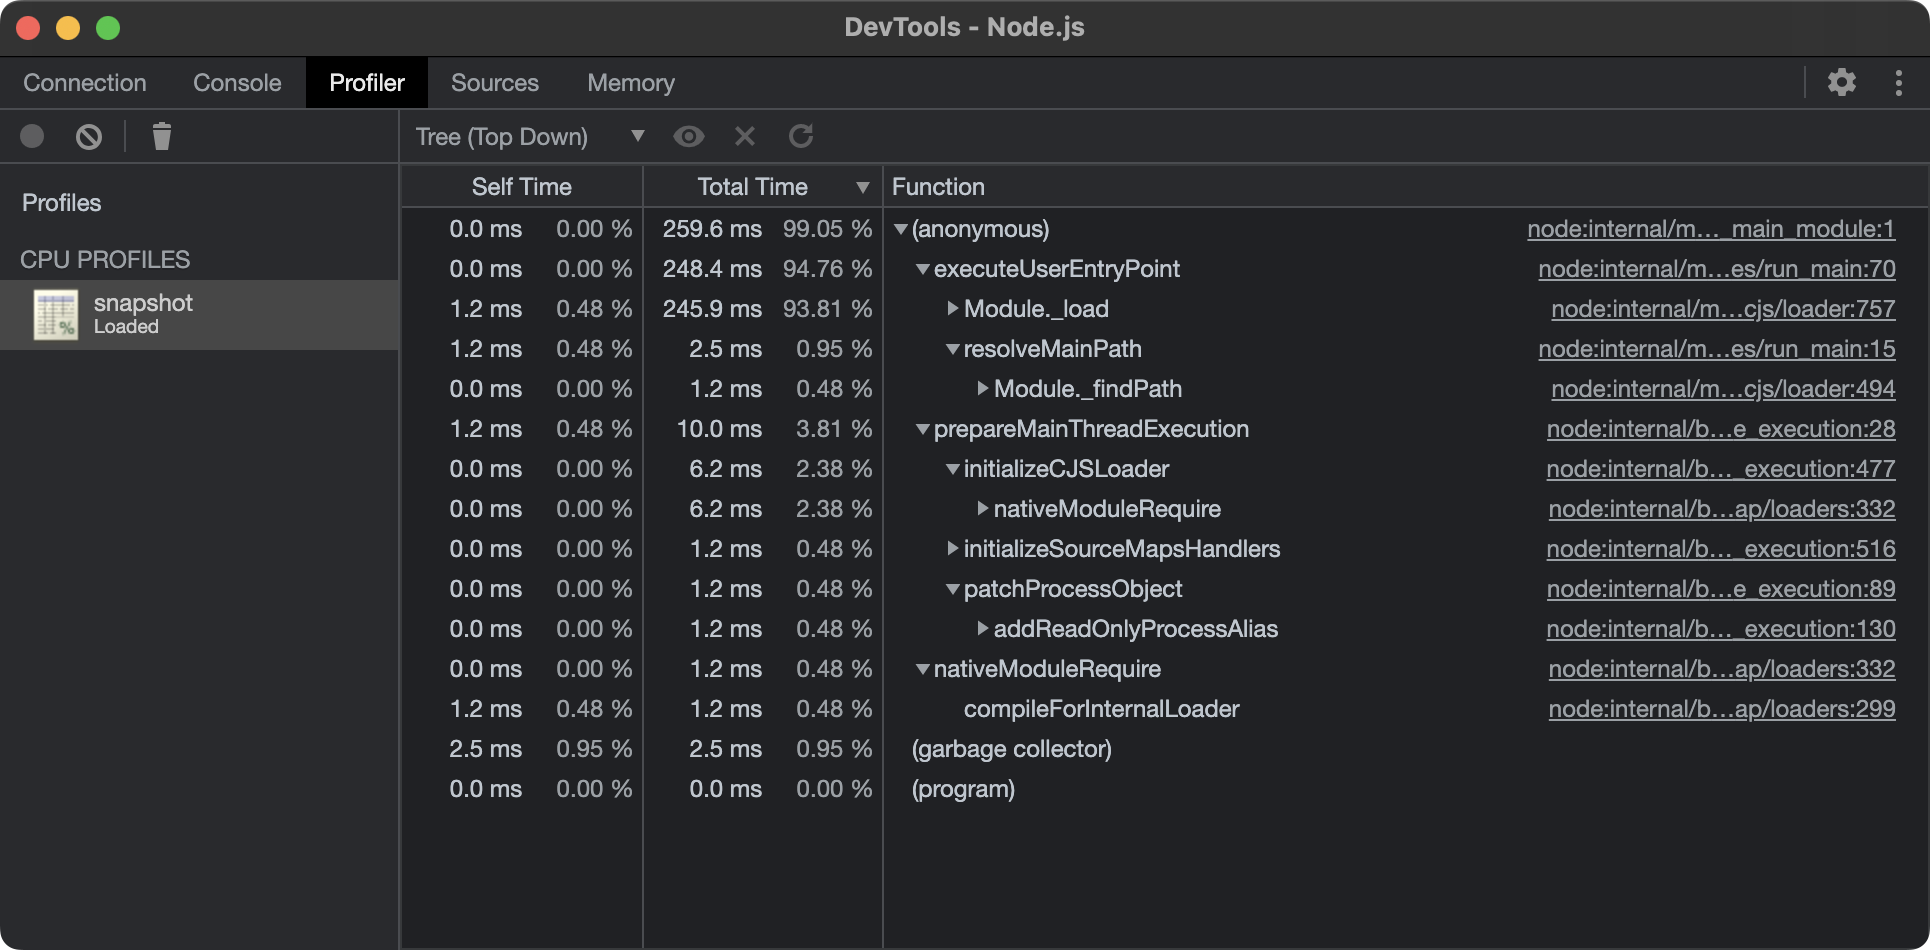
- The following window will popup. Ensure the "Profiler" tab is selected.
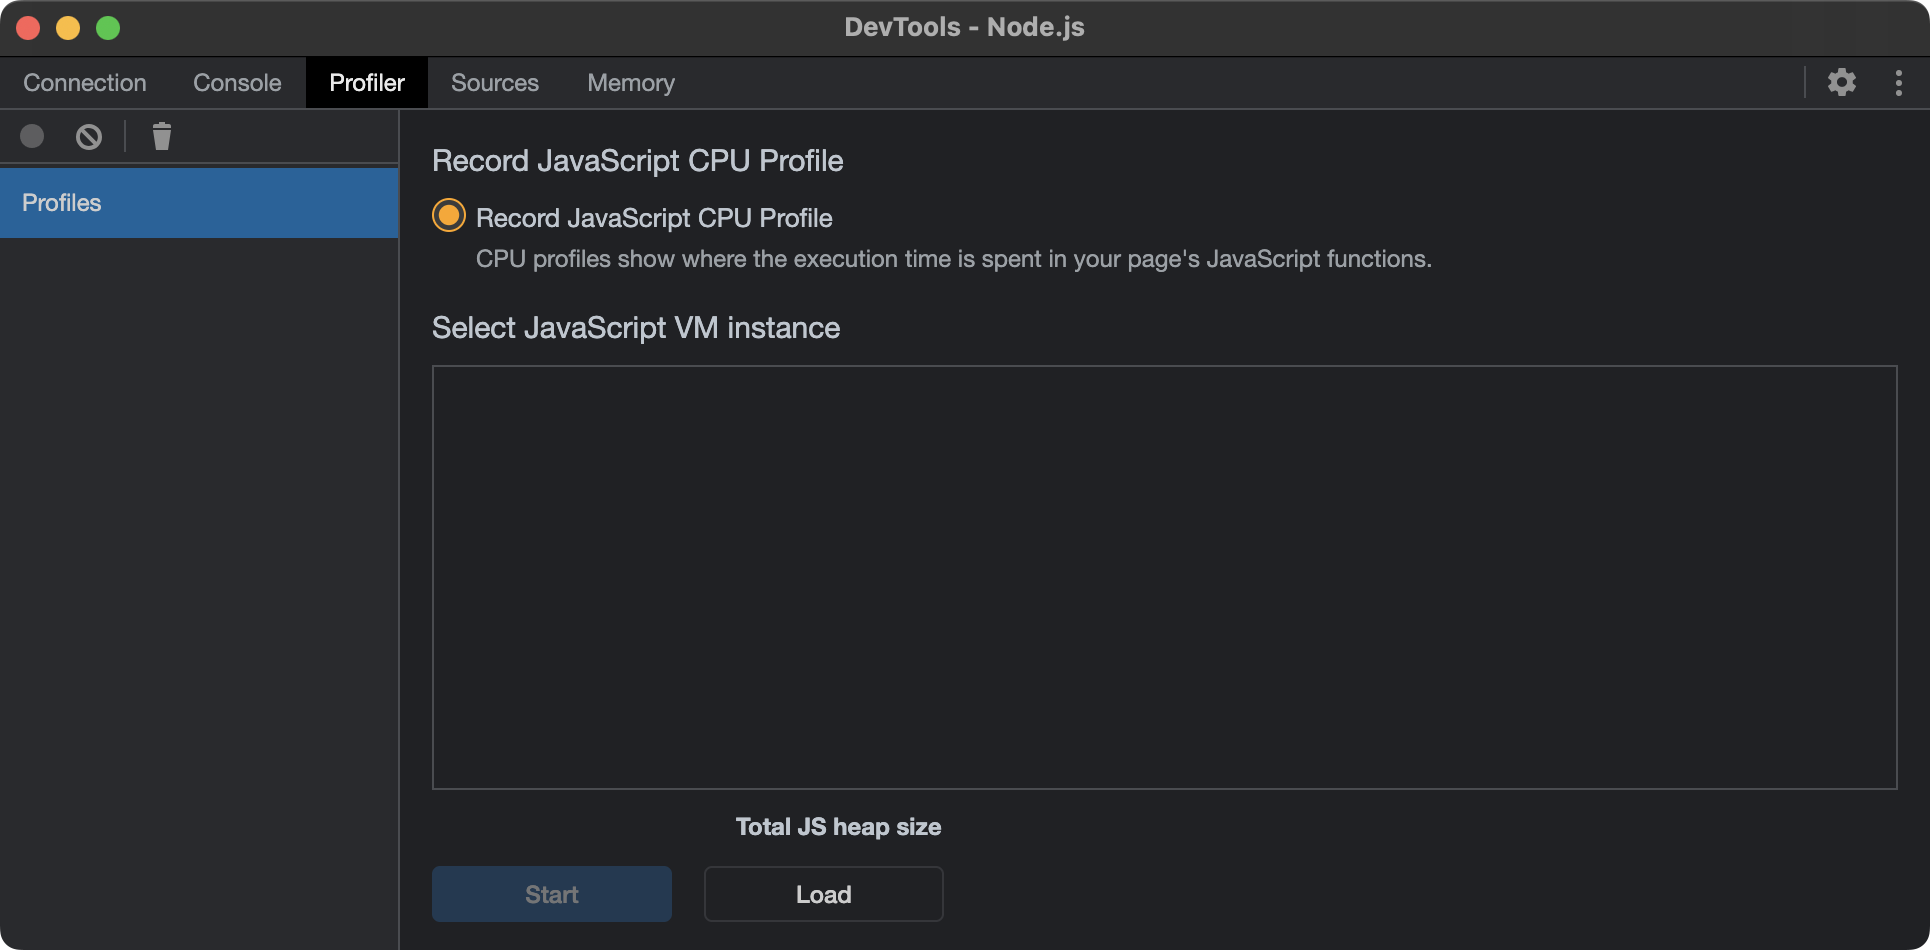
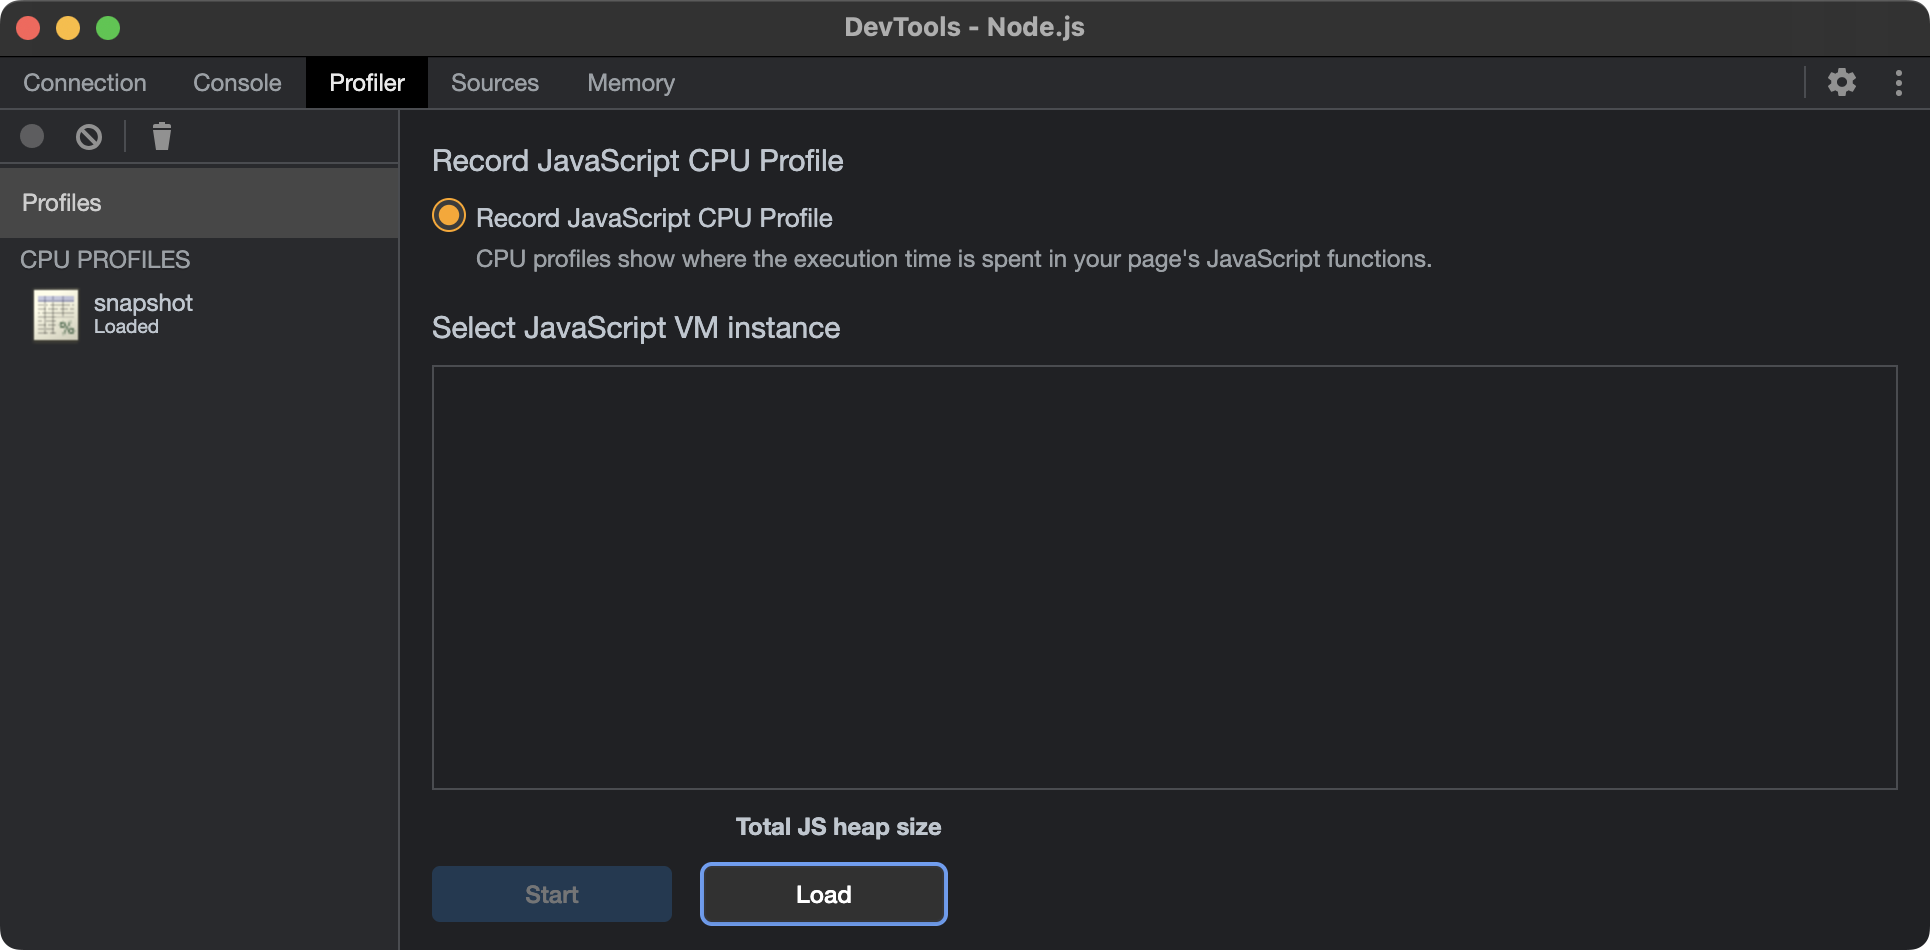
- Click "Load" and select the
snapshot.cpuprofilethat was previously recorded. If successful, the snapshot will appear in the left column.
On macOS, press
command+shift+.to display hidden files and folders, to locate the.moonfolder.
- Select the snapshot in the left column. From here, the snapshot can be analyzed and represented with Bottom up, Top down, or Flame chart views.
Heap snapshots
Heap profiling lets you detect memory leaks, dynamic memory problems, and locate the fragments of code that caused them.
Record a profile
To record a heap profile, pass --profile heap to the moon run command. When
successful, the profile will be written to
.moon/cache/states/<project>/<task>/snapshot.heapprofile.
$ moon run --profile heap app:lint
Analyze in Chrome
Heap profiles can be reviewed and analyzed with Chrome developer tools using the following steps.
- Open Chrome and navigate to
chrome://inspect. - Under "Devices", navigate to "Open dedicated DevTools for Node".
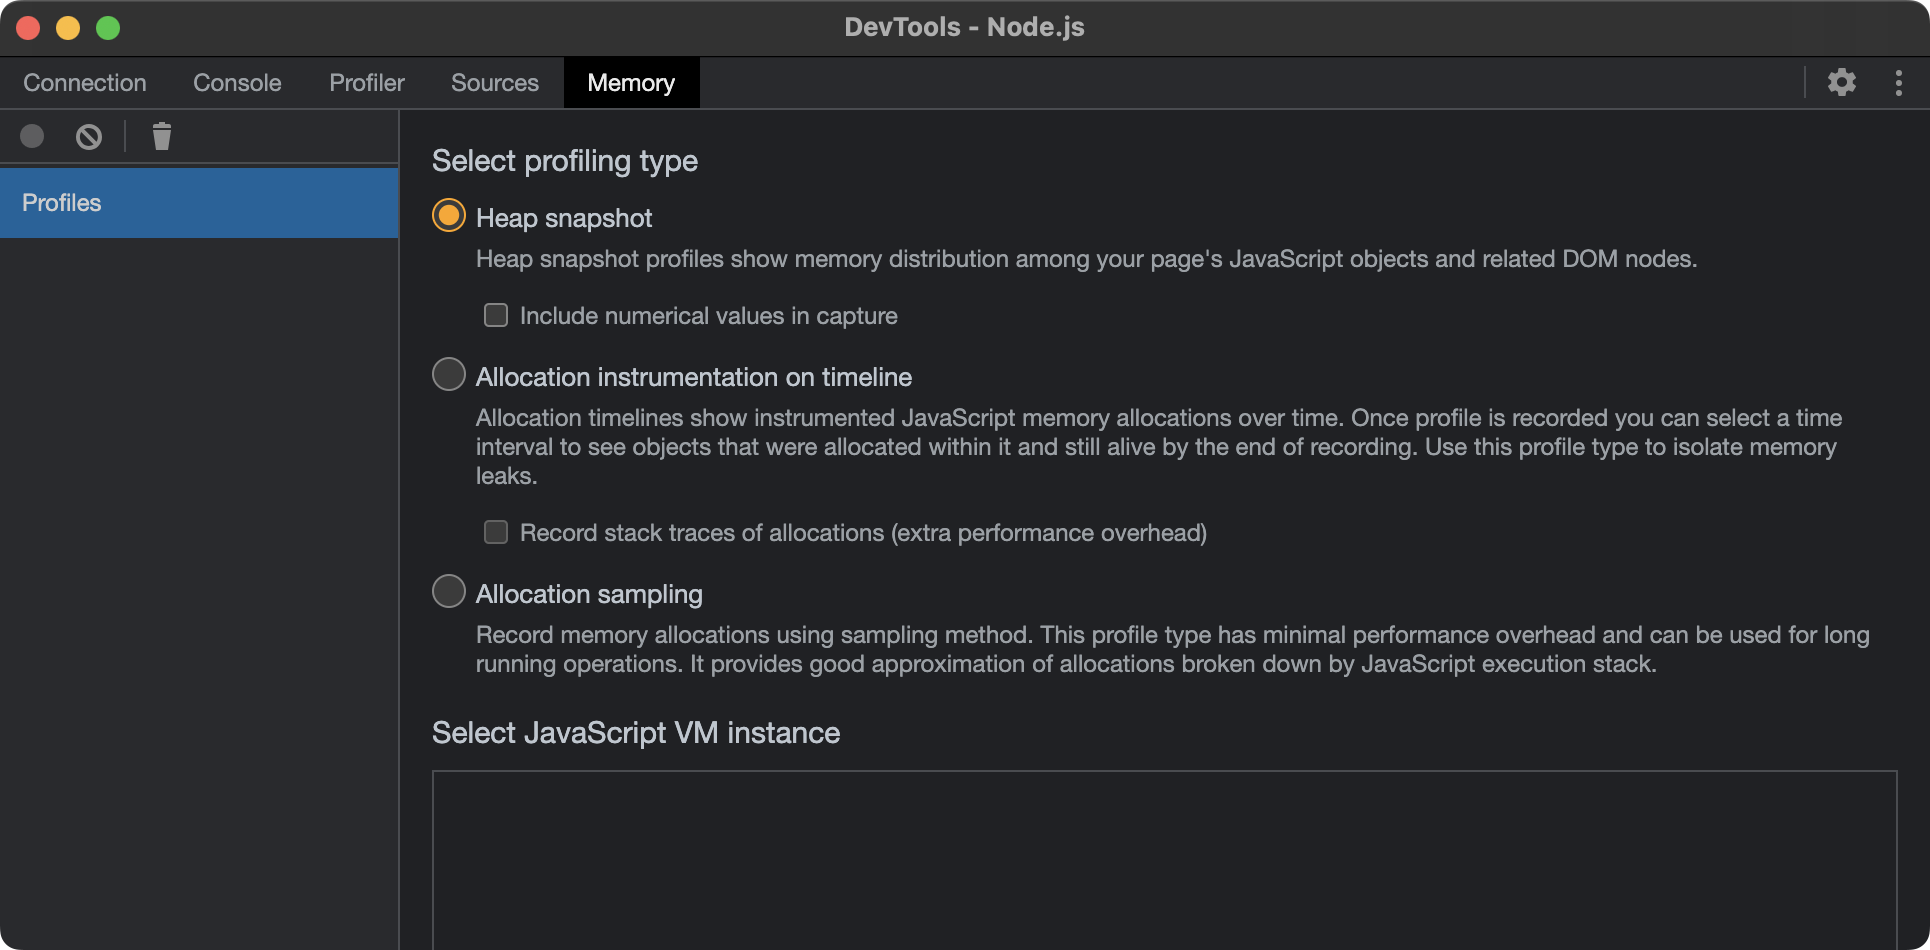
- The following window will popup. Ensure the "Memory" tab is selected.
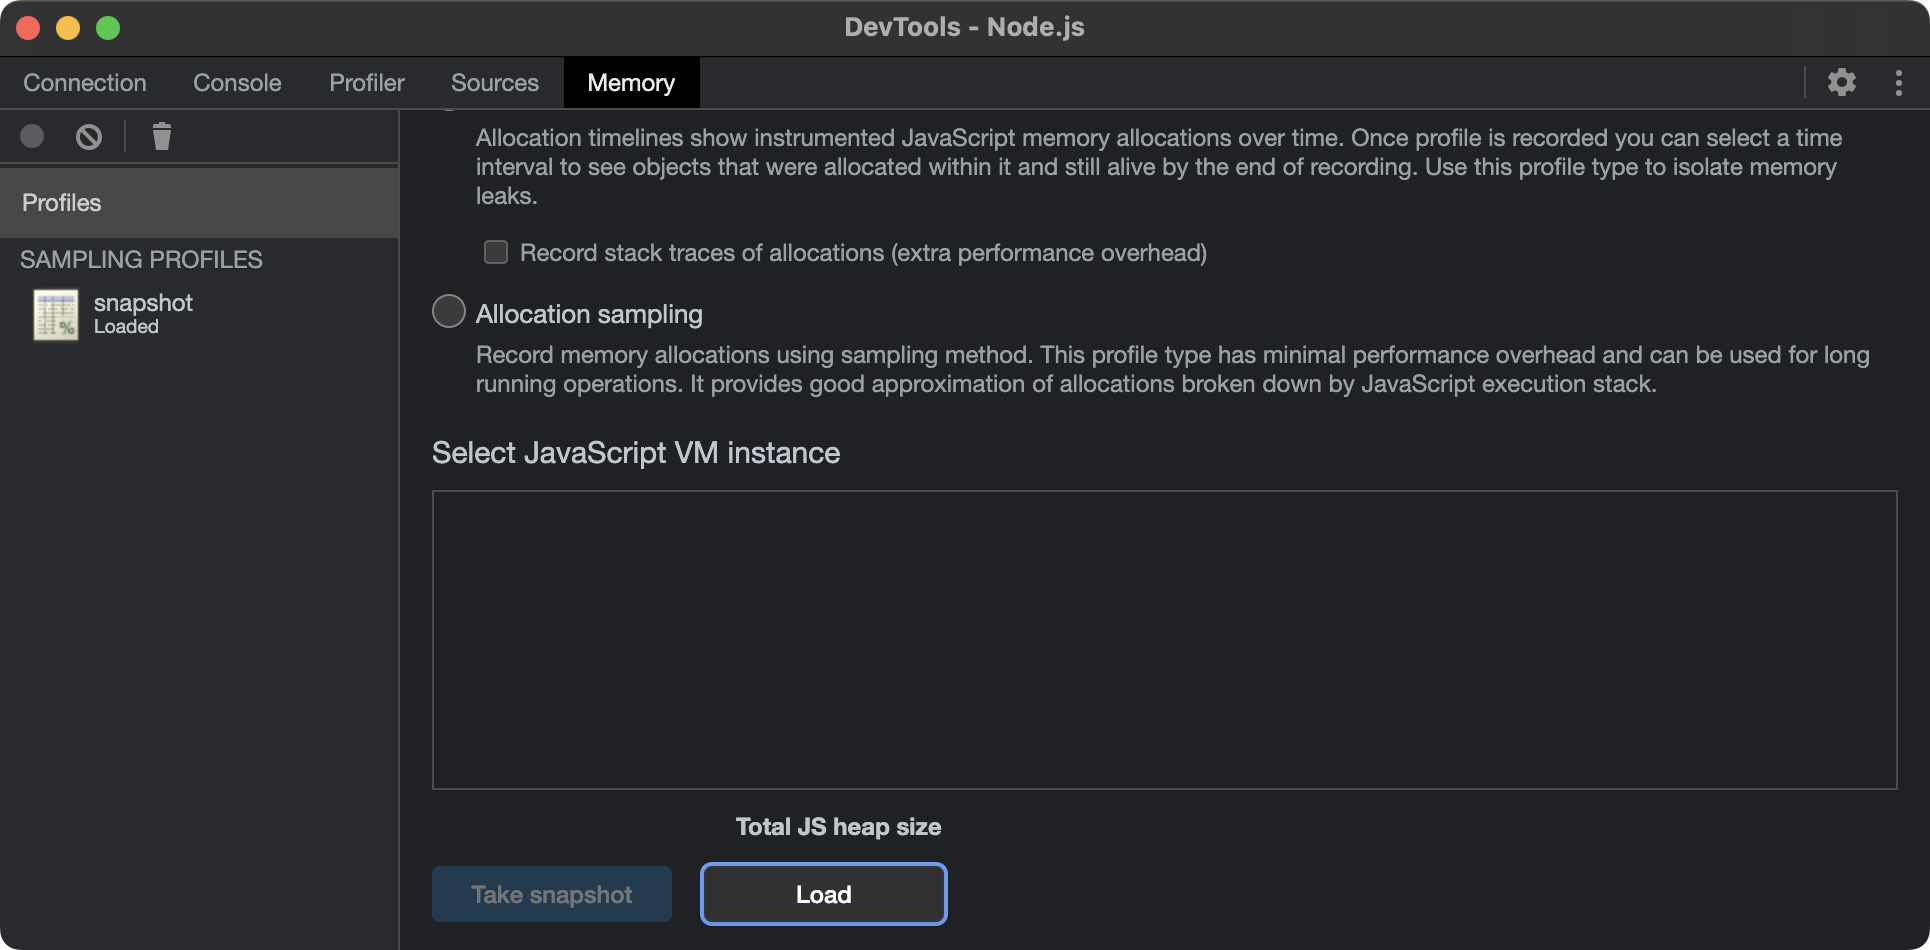
- Click "Load" and select the
snapshot.heapprofilethat was previously recorded. If successful, the snapshot will appear in the left column.
On macOS, press
command+shift+.to display hidden files and folders, to locate the.moonfolder.
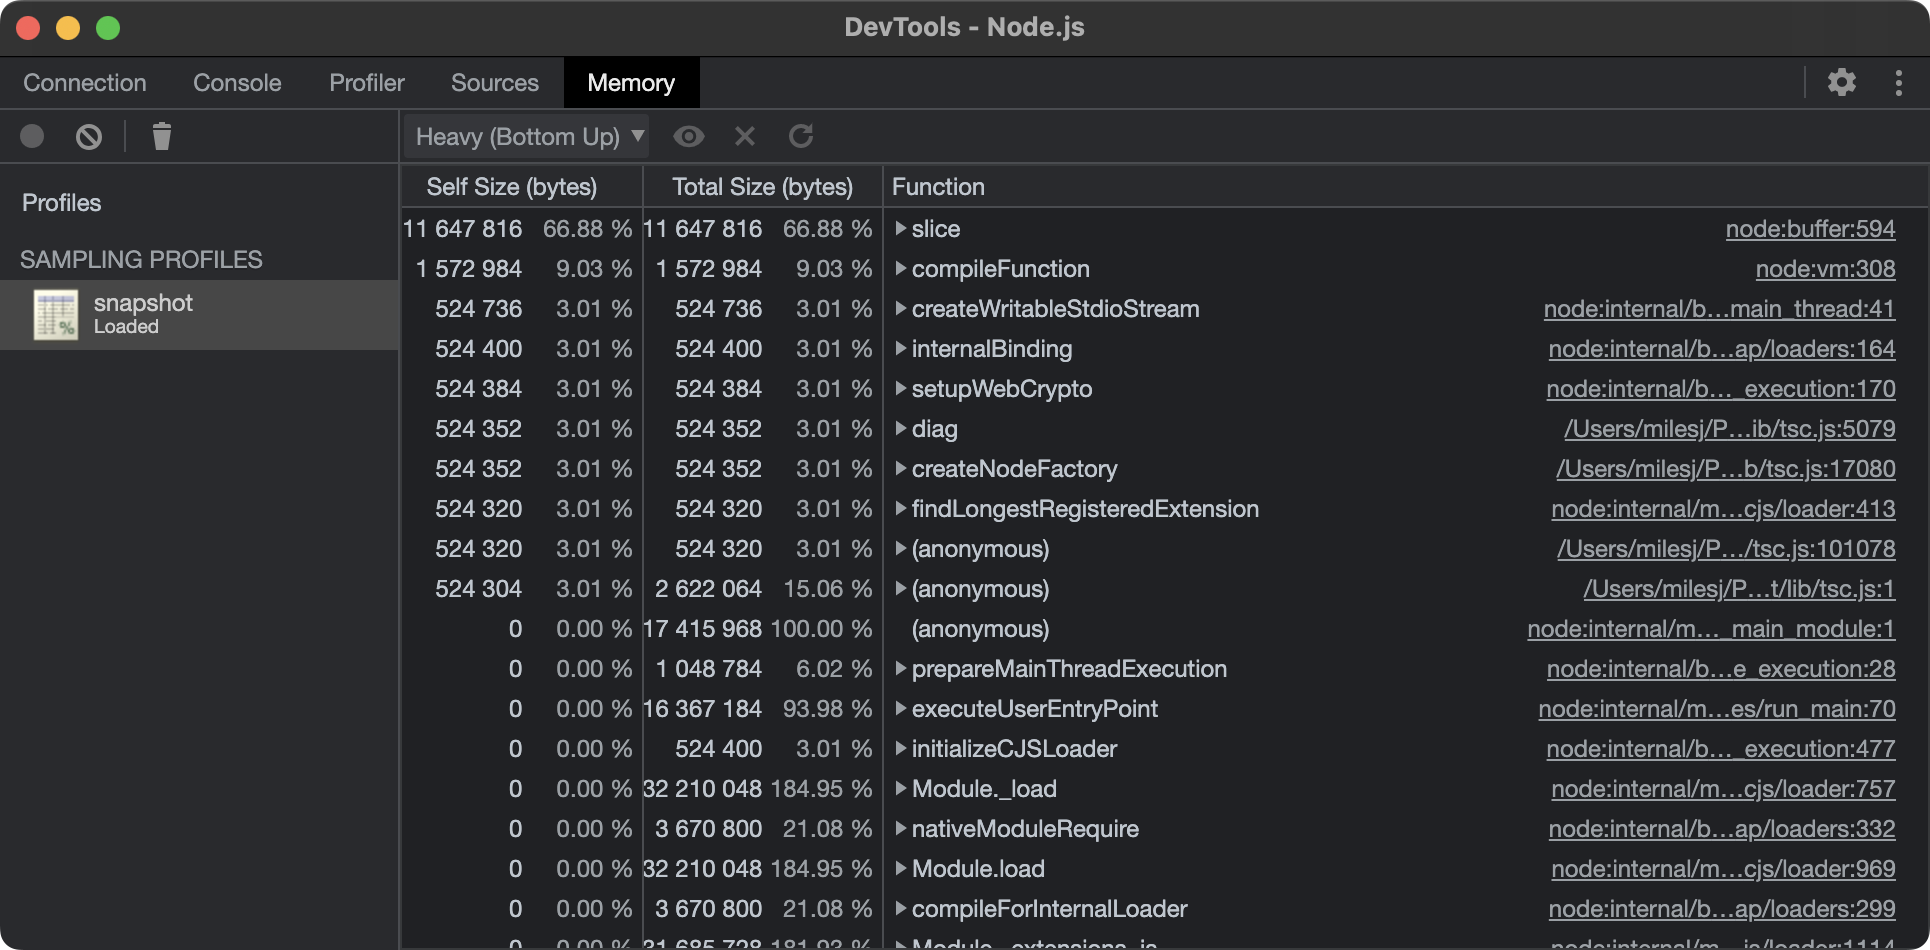
- Select the snapshot in the left column. From here, the snapshot can be analyzed and represented with Bottom up, Top down, or Flame chart views.
Views
Chrome DevTools provide 3 views for analyzing activities within a snapshot. Each view gives you a different perspective on these activities.
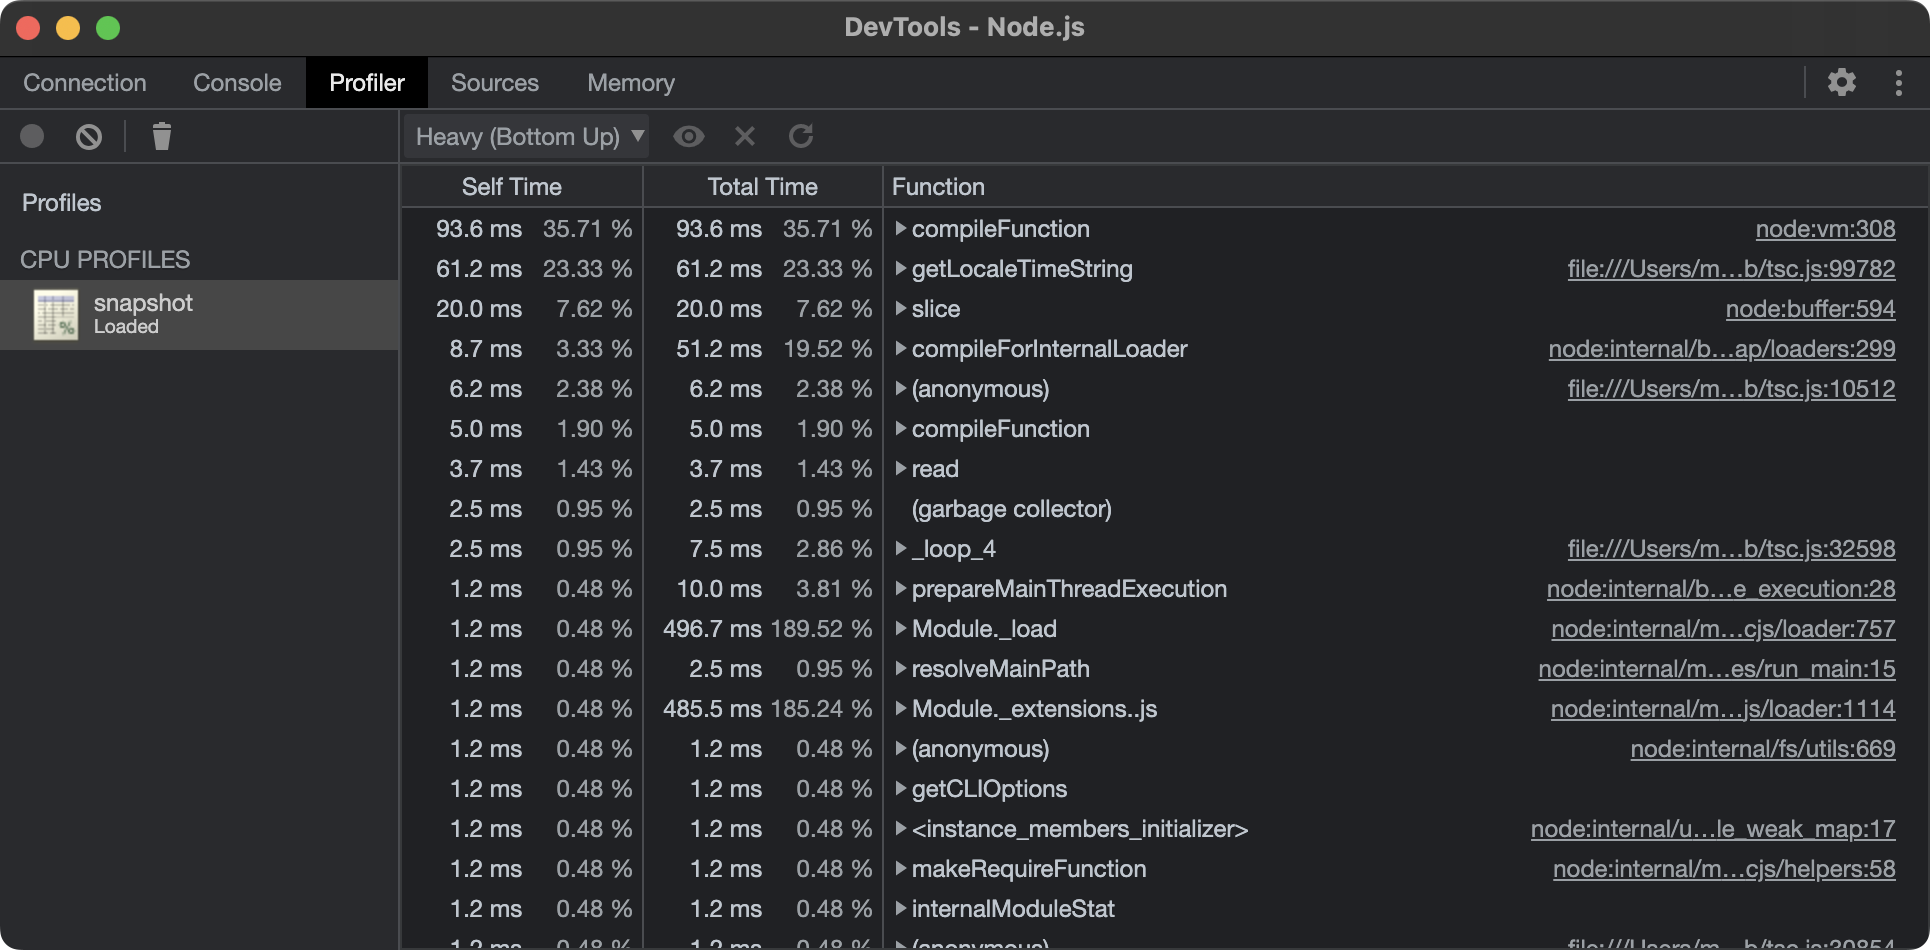
Bottom up
The Bottom up view is helpful if you encounter a heavy function and want to find out where it was called from.
- The "Self Time" column represents the aggregated time spent directly in that activity, across all of its occurrences.
- The "Total Time" column represents aggregated time spent in that activity or any of its children.
- The "Function" column is the function that was executed, including source location, and any children.
Top down
The Top down view works in a similar fashion to Bottom up, but displays functions starting from the top-level entry points. These are also known as root activities.
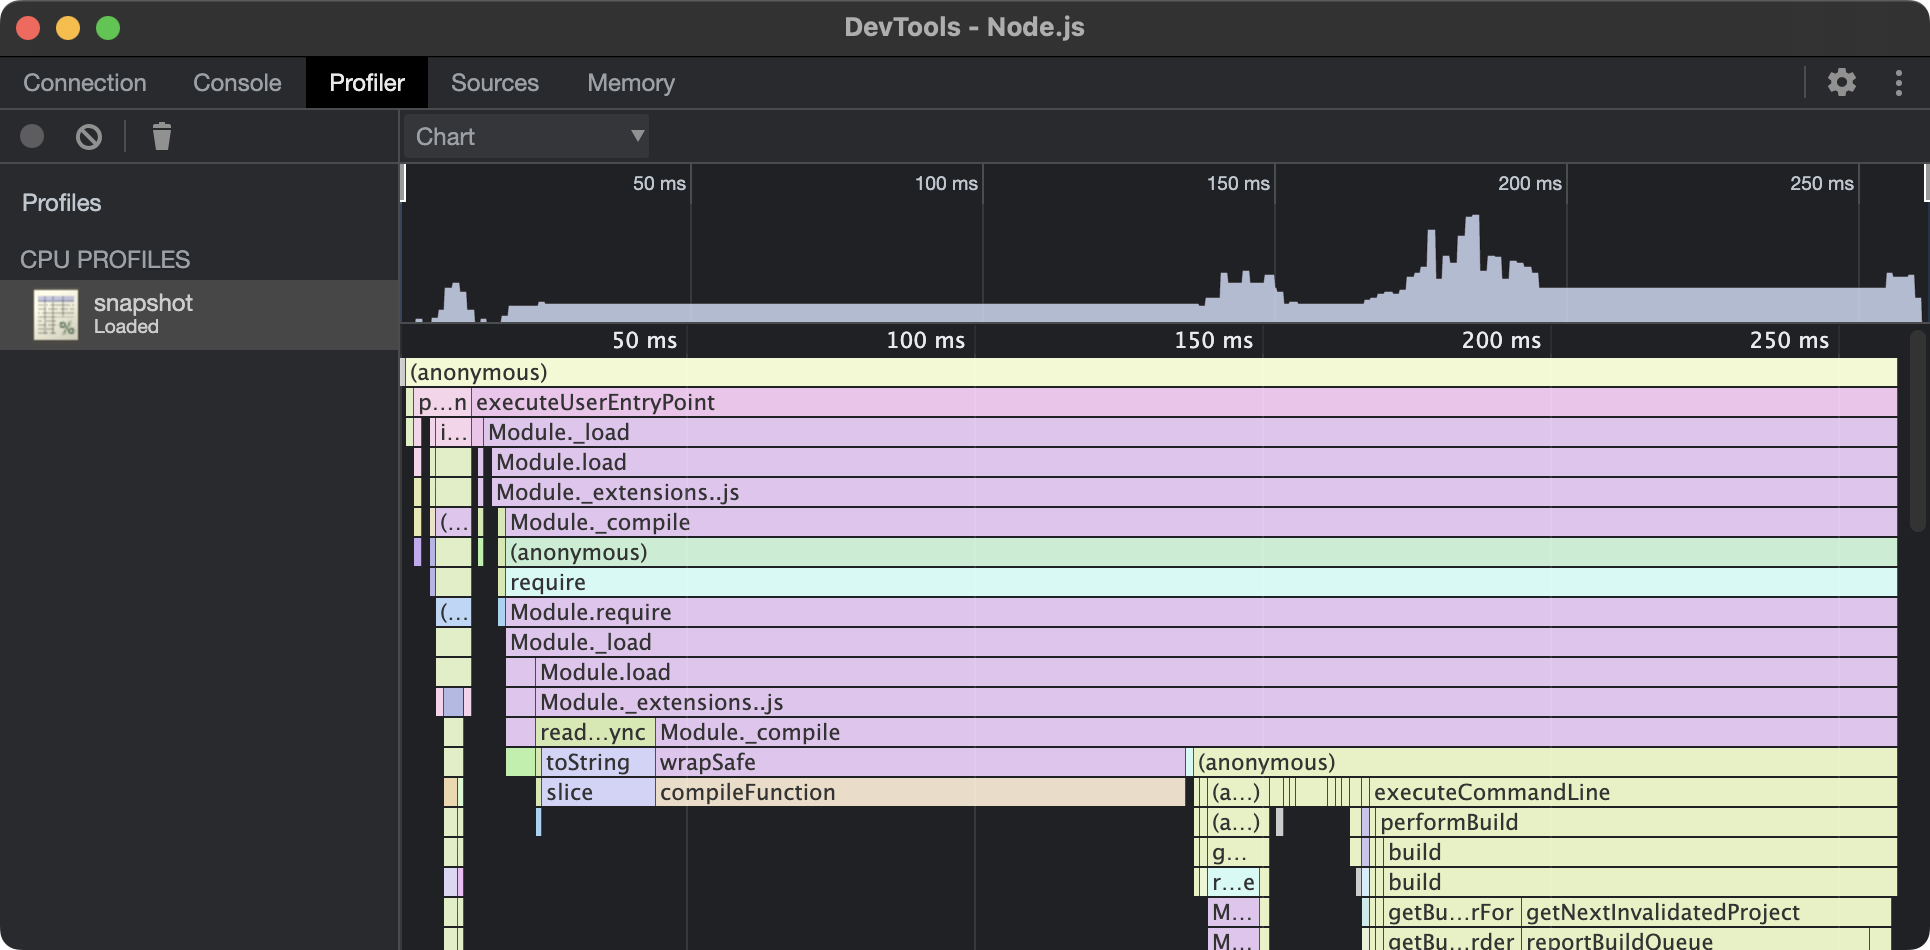
Flame chart
DevTools represents main thread activity with a flame chart. The x-axis represents the recording over time. The y-axis represents the call stack. The events on top cause the events below it.